* I've been examining the past half century of macroeconomic data, because the national conversation about tax rates, economic health and employment seemed suspect.
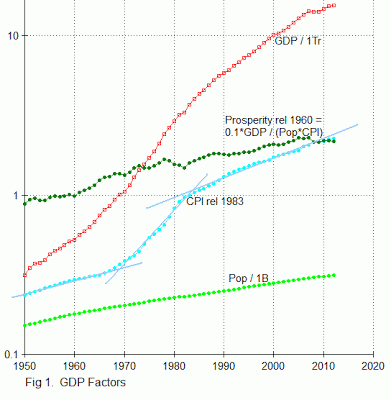
* I've come to believe that gross domestic product (GDP) is not a valid measure of economic health, and its growth is not universally desirable. To a good approximation, GDP growth in recent decades is 15% population growth, 67% inflation, and 18% prosperity growth--as seen in this graph:
Those of us who care about the planet don't cheer for population growth. Those of us hoping for some dignity in retirement don't cheer for inflation. And since Republicans took power in 1980, essentially all prosperity growth has gone to the advantaged, this not to be praised by laborers, minorities and those of us wishing for more justice and balance.
* I've come to believe that the only macroeconomic variable worth cheering for is employment rate. There have been four substantial employment-rate recoveries in the past half century and two minor ones, these depicted in the over-struck phases of the unemployment plot in following graph:
Three substantial recoveries began during long periods of constant tax rates (income, capital gains, inheritance). One of them began after tax-rate reductions but also after large reductions of oil price from a stifling $100/barrel and of constant-maturity-treasury (CMT) interest rate from a stifling 20%, at a time when we still made much of what we consumed and so were hungry for credit. In fact, all employment recoveries followed interest-rate reductions and/or oil-price reductions. Interest rates are now negligible, so we need to explore new actions to increase employment rate without harmful side effects.
* In passing, note that the prosperity curve declined between 1978 and 1982, the period of peak oil price and peak CMT interest rate. It also declined between 2007 and 2009, when oil price again peaked and the housing bubble popped. Prosperity trends would be hard to identify in real time. It is interesting also that the CPI curve shows a phase of high inflation between 1968 and 1982, especially after 1973. Back then I attributed this to a strong labor movement and OPEC.
* There is not a scintilla of evidence supporting the hypothesis that cutting income, capital-gains and inheritance tax rates benefits average Americans. Tax cuts increased national budget deficits, increased national debt and enriched the rich--claims from the Business Round Table, Heritage Foundation, Cato Institute and local economists notwithstanding. This transfer of wealth from treasury to the privileged can be appreciated from the following two graphs:
*From http://www.usgovernmentspending.com:
Observe the climb of government debt relative to GDP following Reagan's reductions of income and capital-gains tax rates and his increase of spending relative to GDP.
*From Fred the Oyster at commons.wikipedia.org:
Observe the climb of Top 1% income share after Reagan's tax-rate reductions and spending increases. Both government debt and Top 1% income share rose again after Bush II's tax cuts.
* Next time someone claims economic benefits of tax cuts, please insist that they show you the data!
* Two recommendations emerge from these considerations: 1) Since the Bush tax cuts transferred money from the US Treasury to already rich people without improving economic health, Obama should let them all expire during the lame-duck period regardless of protests from the business world and regardless of his own four-year-old campaign rhetoric. 2) By decree or statute, all multistate retailers should be required to increase their US manufacturing labor expenditure by 1% of their foreign manufacturing labor expenditure after any year in which our unemployment rate averages above 7%--this constituting a walmartization-limiting negative feedback loop. There are several other innocuous tweaks that would improve the US employment rate.
Monday, October 22, 2012
Subscribe to:
Post Comments (Atom)


1 comment:
"Prosperity rate" is a weird measurement and is not used by academic economists in my experience. 0.1*GDP/CPI*Pop??? It just seems like a weird GDP per capita calculation.
Using measures such as HDI and FRED's real wages calculations, we can make better insights on how life is for individuals.
Post a Comment